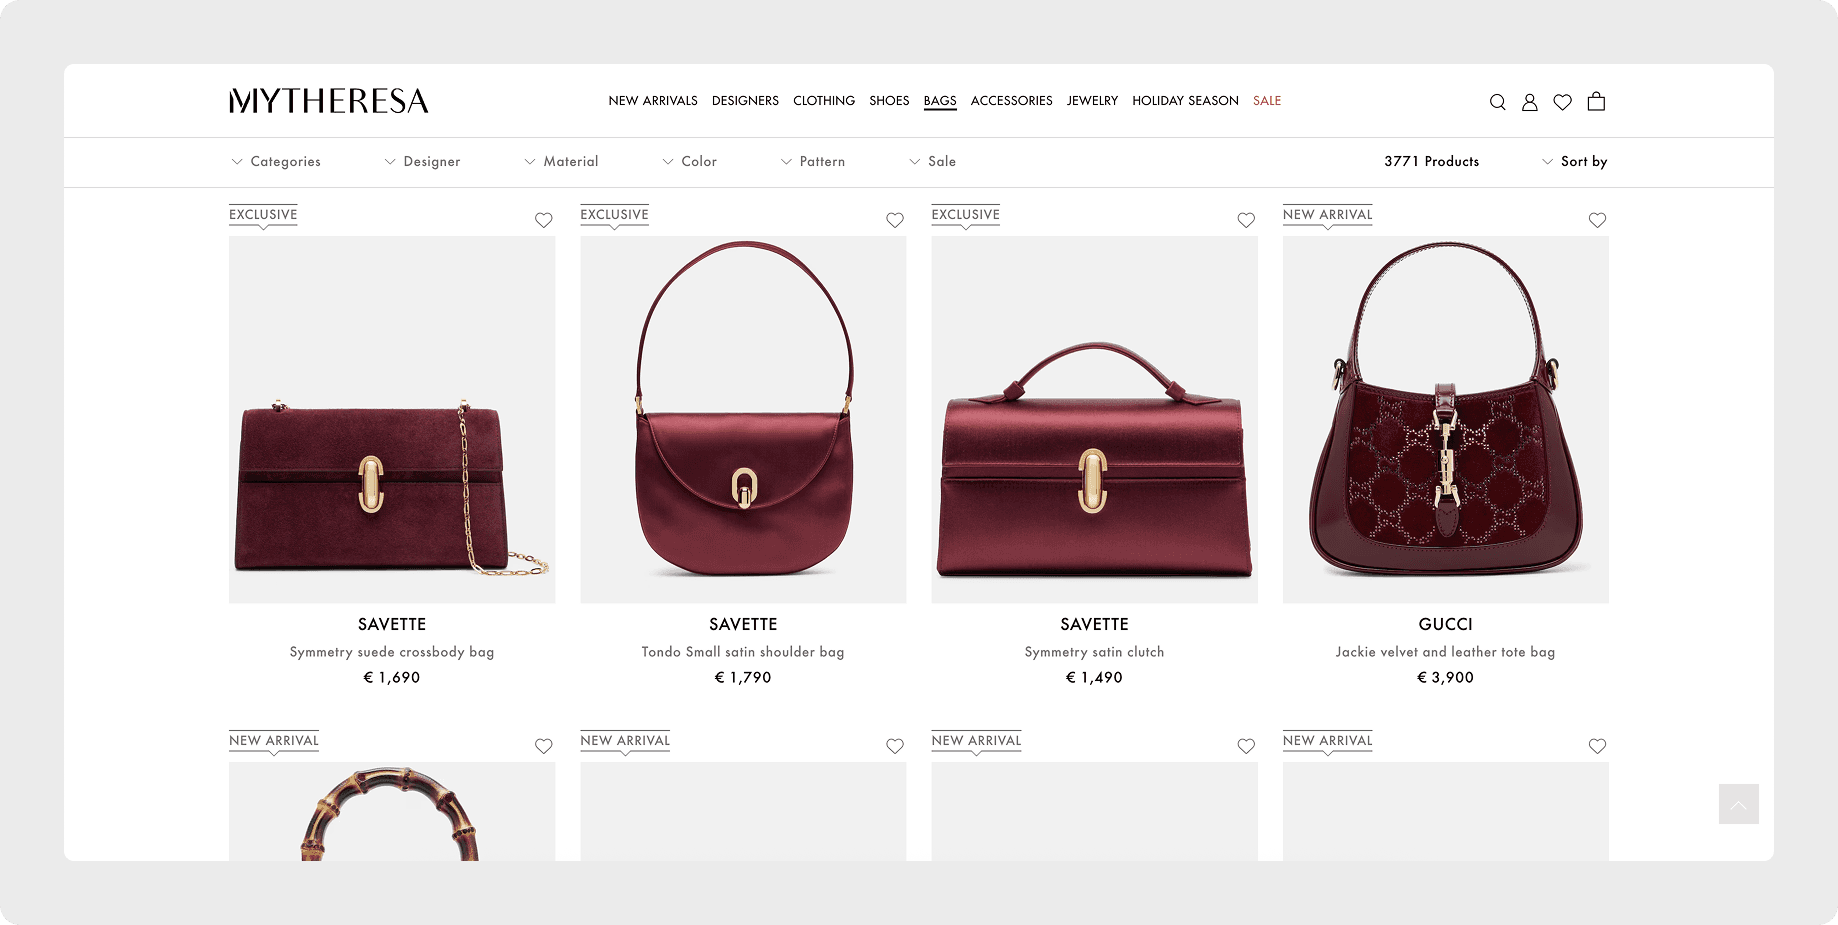
Mytheresa is a leading digital luxury fashion platform known for its finest edit of over 200 designer brands. It targets high-end shoppers by offering a curated, experience, exclusive content and seamless digital interaction.
The goal was to transition Personal Shoppers from manual Excel sheets to a unified, data-driven performance dashboard in Mochi, providing real-time client metrics and actionable sales strategies.


Prior to this project, the Personal Shopper (PS) team relied on manual data aggregation via Excel sheets to track client engagement and sales impact. This process was time-consuming for the team and provided zero immediate visibility for Team Leads to conduct effective performance reviews.
The primary user need was two-fold:
Efficiency: Provide a single source of truth for key performance metrics, eliminating manual data checks.
Actionability: Connect performance data directly to client profiles, allowing PS to take immediate, revenue-driving actions (e.g., creating new catalogue links).
The ultimate business goal was to increase the efficiency of the high-value PS team and provide leaders with the necessary insights to coach for improved conversion rates.

I served as the sole UX/UI Designer on this project, partnering closely with the Product Manager and the PS Team Lead (key stakeholder).
My responsibilities spanned the entire product development lifecycle:
Discovery & Research: Conducting user interviews to define pain points and needs.
Information Architecture (IA) & User flow mapping: Structuring the data hierarchy and mapping the new efficient user journey.
High-fidelity UI design: Adhering to the existing Mochi Design constraints.
Stakeholder alignment: Validating data points and feature hierarchy with the Team Lead.
Developer handoff: Preparing final specs and instructions for the engineering team.
I started by conducting in-depth shadowing and interviews with PS team to understand their work persona. Key qualitative insights revealed that the shoppers are highly efficient, action-oriented professionals driven by sales commissions and strict quotas.
Personal Shoppers are not 'data analysts'; they need simple, actionable insights that tell them which client to focus on next to maximize their sales quota and 'not drop the ball' on potential purchases.

A critical step in defining the solution was mapping the inefficiency of the existing process versus the potential efficiency of the new tool.
Mapping the legacy flow (6+ steps):
The previous workflow was fragmented and resource-heavy:


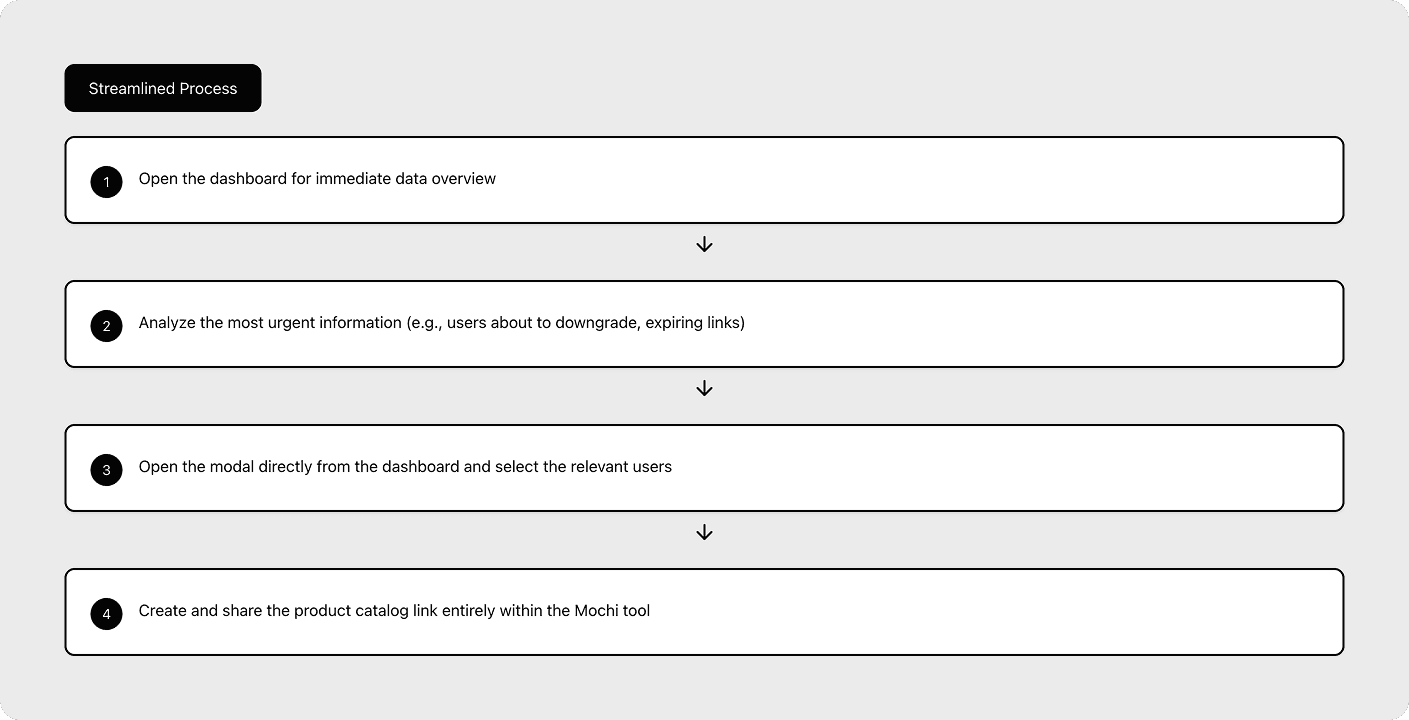
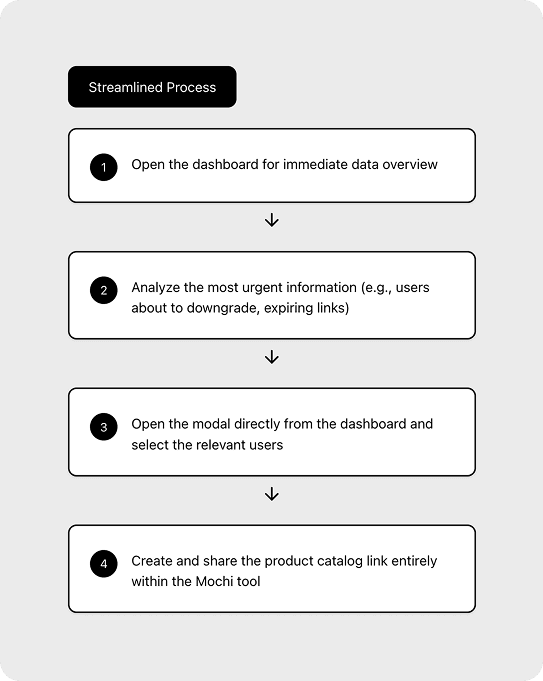
Mapping the optimized dashboard flow (4 steps):
The new design significantly reduces cognitive load and steps:
To ensure the dashboard design was strategically aligned with user priorities, I also employed an information hierarchy matrix inspired by the Eisenhower Matrix. This framework helped us prioritize the 10+ data points, determining which required high visibility (e.g., revenue trends, expiring links requiring immediate action) versus those that could be nested.


The high-fidelity UI was developed within the tight constraints of the Mochi system.
Mochi utilizes a very simple component scheme, primarily relying on a limited black-and-white color palette and minimal iconography. Recognizing the immediate business need for a quick MVP to gather live data, the development team and I agreed to keep the UI highly functional and basic, focusing design effort strictly on data clarity and call-to-action priority over visual flair.
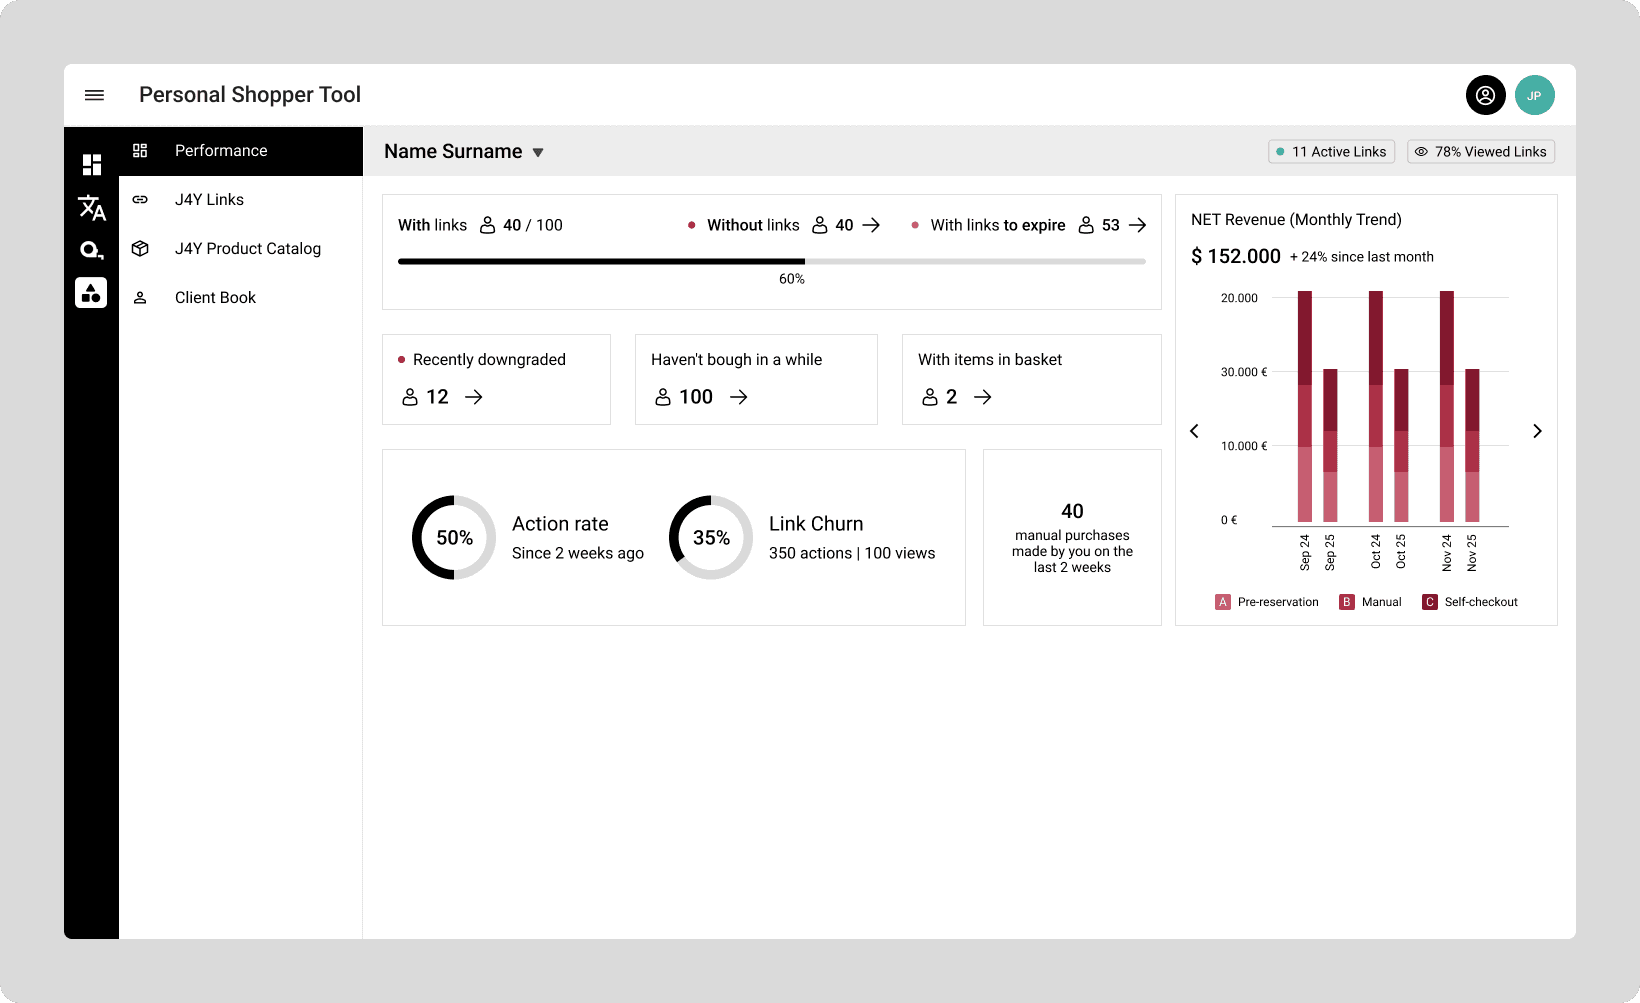


The dashboard was highly acclaimed upon launch, providing immediate value by eliminating manual reporting.
The most significant measure of success is the increase in Personal Shopper efficiency:
Legacy process time: Based on user interviews and shadowing, the old, multi-tool process took approximately 30 minutes per client to check status, confirm data, and generate a new link.
New dashboard time: With the streamlined flow, Personal Shoppers collectively estimated that they could complete the full user flow (analyze > select > create > share) for 3 to 5 clients within 30 minutes.
This transition would represent an increase in productivity per time unit of 200% to 400% (3-5 clients vs. 1 client in the same time frame). This dramatic efficiency gain would allow the high-value PS team to focus more time on client relations and sales execution.
Success is currently being measured through planned monthly feedback sessions with Team Leads and, critically, by implementing data tracking to quantify usage patterns and the reduction in time spent on manual reporting.
The design was built with scalability in mind, ready to accommodate future features and data points.